I felt that I should write another small blog post on Cisco Systems, since their quarterly financials were released today and caused over a 10% drop in the share price. I took a quick glance at the numbers and immediately felt that the market is greatly over-reacting to earnings falling short of analyst estimates. Both revenue and gross profit increased slightly over last quarter and more significantly over the year-ago quarter. Profit margins, research and development, and selling/general/administrative costs all stayed stable over the last four quarters. Net income only shrunk slightly over that of last quarter, and earnings per share stayed around the same. Owner earnings actually grew by 12% over last quarter, and there was only a small increase in the number of shares outstanding.
I take all this to mean that my original investment thesis on Cisco still stands, despite the significant drop in share price. Therefore, further purchase of shares would make sense for me, since the long-term fundamentals of the company have changed very little or not at all. I am not concerned that the stock price has dropped by around 17% from my initial entry point. I am still convinced that Cisco has great potential over the long term, and am comfortable with my conviction. I would only take a loss of 17% in value if I were to sell my shares right now, but I don't intend on doing so for a very long time yet.
Disclosure: I am long CSCO.
Showing posts with label analysis. Show all posts
Showing posts with label analysis. Show all posts
Thursday, May 10, 2012
Wednesday, May 2, 2012
Stock Analysis: Cisco Systems, Inc. (NASDAQ:CSCO)
I haven't posted a stock analysis in a long time, and I've learned a lot about fundamental analysis since my last "stock analysis". I put that in quotes because my previous analysis mainly involved the use of common ratios and how they fit into a relatively rigid dividend growth investing strategy. More recently, I have begun analyzing stocks based on their income statements, balance sheets, cash flow statements, annual reports, and proxy statements. In addition, I intend to only invest in businesses that I understand. My circle of competence is relatively small, but I am beginning to expand it by learning about a second industry. I have just recently finished a Bachelor of Computer Science degree, and so my only real area of expertise is technology. Tech stocks are unpopular with a lot of Buffett-style value investors because their competitive advantage(s) usually rely on continuous capital expenditures and research and development. With that said, it's still my best area of knowledge and I've done a thorough enough analysis that I am personally comfortable with. So without further ado, I'll dive into my analysis of Cisco Systems Inc.
If you aren't aware, Cisco Systems' core product line is the development of equipment for computer network routing and switching. The entire Internet and all private networks rely on routing and switching equipment, and Cisco is the biggest name for enterprise routing and switching, and a significant competitor in the consumer router space.
All of my numbers-oriented discussion relates to the past four years of annual financial data regarding Cisco. They would be best summarized in a bullet list:
I haven't done extensive research on the quality of Juniper Networks' router and switch products, but I would imagine that they are inferior to those of Cisco based solely on the fact that Juniper Networks has been around since before 2000 and I had never heard of them or seen any of their products in use at various software development positions I've held. This is somewhat anecdotal, but I feel that it is telling of Cisco's brand recognition and large market share.
If you aren't aware, Cisco Systems' core product line is the development of equipment for computer network routing and switching. The entire Internet and all private networks rely on routing and switching equipment, and Cisco is the biggest name for enterprise routing and switching, and a significant competitor in the consumer router space.
All of my numbers-oriented discussion relates to the past four years of annual financial data regarding Cisco. They would be best summarized in a bullet list:
- Consistent gross margin around 64%
- Consistent R&D expense around 22% of gross profit
- Consistent selling/general/admin expense around 42% of gross profit, which isn't a bad percentage
- Net income as a percentage of revenue is consistently above 15%
- Over $44 billion in cash and short-term investments
- Cash/short-term investments plus accounts receivable is consistently around 2 times current liabilities
- Four times annual net income is consistently around 2 times long term debt (could pay off all long term debt within 4 years or less, using only net income)
- Return on assets is 10% on average
- Consistent retained earnings growth
- Return on equity consistently greater than or equal to 14%
- Debt-shareholder equity ratio consistently around 0.8
- Consistent annual decline in shares outstanding by around 3%
- Capital expenditure divided by net income is 16% on average (even 25% or less is good)
- Average annual owner earnings of $8,004 million (Net income + Depreciation/Amortization - Capital expenditure)
The thing you immediately notice about this bullet list is that consistency is mentioned in almost every bullet point. That is why I focused on average values or approximate values, rather than percentage growth or decline year over year, but more on that later. Consistent cost management and return on assets/return on equity make for a pretty dependable stock. Debt is not used in excess, and is manageable in terms of being able to service the debt. Retained earnings growth, share repurchases, and lots of owner earnings are all good signs too.
Another point that I left out to talk about separately is that the company has recently begun paying a quarterly dividend. At the moment, the payout ratio is only 8%, but Cisco has more than enough owner earnings and cash to pave the way for long-term dividend growth. If I start building a position in the stock now to hold over the long term, the dividend yield-on-cost could be significant.
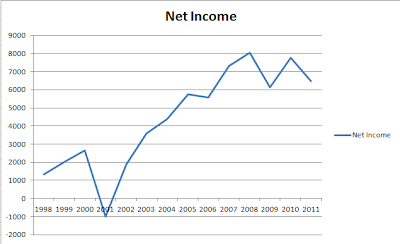
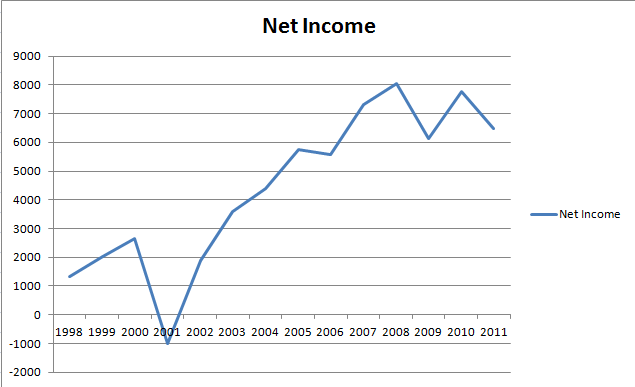
Unfortunately, revenue growth, net income growth, earnings per share growth and owner earnings growth are not consistent year over year, but they do seem to be in a long-term upward trend, despite dips every other year recently. The following chart gives a quick visual of Cisco's net income since 1998:
An investment should not be made based solely on financial statement numbers, and so I will now move on to a discussion of the company's management and macro-economic outlook. To start, I will state some quotes from Cisco's 2011 proxy statement. Out of all the corporate governance policies, three stood out to me as good elements to see in a company:
- "The independent members of the Board of Directors meet regularly without the presence of management" - This is good because there is no pressure on the board to withhold negative comments or constructive criticism of the CEO, which would be the case if he were present. It is the job of the board to evaluate the CEO and reward his performance or lack thereof accordingly.
- "Cisco has adopted a compensation recoupment policy that applies to its executive officers". Further reading in the proxy shows that this comes into effect in the case of a restatement of past financial statements. This motivates the executives to ensure honesty in the financial statements.
- "Cisco has stock ownership guidelines for its non-employee directors and executive officers". In particular, the proxy goes on to say that the CEO is required to own 5 times his base annual salary in Cisco common stock. In reality, "[the] CEO holds over 100 times his base annual salary in Cisco common stock". This means that it is in the interest of the board and the executives to put shareholder interests above all else.
I listened to Cisco's most recent fiscal year-end quarterly conference call, and found the following notes of interest:
- CEO seems to have a good grasp on the technology itself being used in Cisco's router and switch products
- "Intelligent" routers are a main focus of Cisco product development. Coming from a computer science background, I take this to mean that the "intelligence" or routing algorithms are being moved closer to the hardware (the routers themselves). This most likely leads to vast performance improvements in terms of network bandwidth and capacity.
- Cisco customers buy into an entire networking architecture. This makes it easy for customers to upgrade to newer Cisco products as they are developed, and also makes it hard for customers to switch to a different networking architecture from a rival company (due to the amount of time and money it would take).
- Data center trends are moving toward consolidation, virtualization, and private cloud services, all of which Cisco can address with its products. Having worked in software development positions for large private companies, I can see the value that a private cloud would provide for a company's internal intranet, document and source code storage, software compilation and testing, etc.
- Cisco has partnerships with VMware (the biggest virtualization software company) to accomplish these goals.
I don't simply take these statements from the conference call at face value. Because of my understanding of and background in software development and computer science, I can verify for myself that these statements make sense. This is a good example of the importance of investing in a company whose products and services you understand.
In terms of macro-economic trends that would benefit Cisco, I think that the move toward cloud services (both private and provided by 3rd-party companies such as Amazon) will continue to grow. Additionally, the move to Internet Protocol version 6 will necessitate the purchase of equipment that supports the new protocol (which Cisco routers satisfy). The internet in general is constantly growing, and its existing users are constantly demanding faster speeds and more bandwidth. In addition, mobile smartphone growth is also continuing, and network infrastructure is needed to support this growth. For these reasons, I believe that Cisco has a lot of revenue growth potential.
Cisco's closest competitors are Hewlett-Packard and Juniper Networks. I did some quick analysis on Juniper Networks, just to see how competitive they really could be with Cisco. Here are some bullet points that I found over the past 4 years of their financial data:
- R&D costs are consistently above 30% of gross profit
- Much less net income than Cisco (most recently an annual value of $425 million compared to Cisco's annual $6.5 billion)
- Negative retained earnings every year with no discernible upward trend
- Return on equity and return on assets consistently below 10%
- Higher capital expenditure as a percentage of net income on average
One concern that I have about this stock is that Cisco mainly fuels its growth through acquisitions, which can be prone to being more costly than profitable. Cisco has recently announced the end of its Flip Video product line that it acquired several years ago from another company. If many acquisitions are made over time, some of them are bound to turn out badly, to the detriment of shareholders. Luckily, management admits that things turned out badly and discontinues the product line, rather than pumping more money into it. In addition, I believe that Cisco's core router and switch product lines aren't likely to be of such poor quality that earnings will suffer in a significant way.
Finally, valuation of Cisco shares must be considered to see what kind of margin of safety exists at the current price per share. I assumed a conservative growth of owner earnings of 5% annually (although this has the potential to be much higher). Factoring in discounted cash flows over ten years, Cisco's total assets and total liabilities, I came up with a target price/intrinsic value of around $34 per share. As of this writing, Cisco shares closed at $19.84. I have initiated a position and plan to buy more if shares dip even lower in the near future.
Any thoughts on my analysis?
As always, this blog post should not be considered financial advice, and you should always do your own research before making any investment decision. Disclosure: I am long CSCO.
Edit: Click here to read some follow-up thoughts on Cisco Systems after their most recent quarterly earnings release.
As always, this blog post should not be considered financial advice, and you should always do your own research before making any investment decision. Disclosure: I am long CSCO.
Edit: Click here to read some follow-up thoughts on Cisco Systems after their most recent quarterly earnings release.
Monday, March 19, 2012
Hasbro Share Repurchasing: Follow-Up
Back in February, I wrote a blog post about Hasbro Inc.'s use of free cash flow to repurchase shares, and how sometimes the amount of shares repurchased approached or exceeded the company's free cash flow. I'll admit that I initially panicked at my findings, as I was about to make a purchase of Hasbro shares. On the advice of a friend, I did some further investigating on the issue, and I am now writing this blog post to summarize my findings.
I spoke with Hasbro investor relations, and they were very helpful in providing me with details of Hasbro's policies on use of free cash flow. Hasbro generates a healthy amount of cash, and there are multiple options for what to do with that cash. According to investor relations, Hasbro's first priority is to reinvest in the business, typically in the order of tens of millions of dollars. Acquisitions are an option, however they are not typically pursued as the value obtained is not sufficient, but intellectual property is sometimes purchased. Cash could be used to pay down debt, however Hasbro makes use of "good debt" that is manageable and adds to the business's ability to operate. If you take a look at Hasbro's annual balance sheets, their total current liabilities are typically less than their total long-term debt.
At Hasbro, it is a tradition to return cash to shareholders. Hasbro has maintained or increased their quarterly dividend every year since 2002. Hasbro has been buying back shares for a long time, and continues to do so under their current authorization since 2005. Hasbro's reason for buying back shares is to offset dilution of shareholder value as a result of stock-based compensation of management, and to buy back shares over and above that offset in order to increase shareholder value. Hasbro does so opportunistically to take advantage of low share pricing at times. Typically in the past and going forward, Hasbro does not use debt to repurchase shares.
If you look at the table in my last blog post, the only year in which Hasbro spent more than 100% of their free cash flow to repurchase shares was 2010. According to investor relations, this was to offset the conversion of a convertible debt offering issued in 2001 into common stock. Hasbro's net change in cash for 2010 was +$91.75 million, even though it repurchased $546 million of common stock. Hasbro also took on debt that year to raise cash. I had read through multiple annual reports dating back to 1997 from Hasbro in search of why this particular year was so aggressive in terms of share repurchases. I found multiple references to convertible debentures and share repurchases, but I did not find any mention of their connection to each other.
In terms of whether Hasbro believed its shares to be undervalued when purchasing them, the only answer I found was an average price quote for a time period that I should have written down but must have missed, and that purchases were opportunistic.
All in all, I've accomplished some in-depth research on Hasbro, and it was my first time calling the investor relations department of a public company. Hasbro seems to care about share dilution and seems dedicated to returning cash to shareholders, while growing its core brands and operations. I'll mull over Hasbro a little longer, but I don't want to over-analyze it.
Tuesday, February 28, 2012
Giving Cash Back To Shareholders is Nice... When You Can Afford It
Over the past few weeks, I've been looking at various stocks trying to find my very first Warren Buffett-style value investing stock pick. One of my main considerations was Hasbro, Inc. Hasbro has a lot of brand power under their belts: Monopoly, Battleship, Boggle, Pictionary, Risk, Scrabble, Trivial Pursuit, Transformers, Nerf, not to mention more targeted brands such as Magic: The Gathering and Dungeons and Dragons. I went to Zellers the other day and took a stroll through the toy section. Many of the toys were made by Hasbro, meaning that Hasbro has a lot of retail store shelf space at stores like Wal-Mart, Zellers, Toys R Us, and so on. Hasbro has also been diversifying their brands toward movie production, such as Transformers and G.I. Joe. Upon examining the management, I found that the CEO of Hasbro personally heads the Corporate Social Responsibility Committee, a task that could easily have been delegated to a sub-manager. To me, that shows that the CEO actually cares about what goes on at those committee meetings.
When considering Hasbro's financials, I found a lot that matched a checklist I've built, based on reading how value investors like Warren Buffett pick stocks. Hasbro has low capital expenditure, consistent profit margins, return on assets in the 9-10% range, growth in net income and growth in what Buffett calls "owner earnings". Owner earnings, or free cash flow, are equal to the company's net income, plus depreciation/amortization, minus capital expenditures. Since depreciation/amortization are a non-cash expense, the cost is added back in to the equation, and offsetting depreciation/amortization is taken into account by subtracting capital expenditures. The result is the amount of cash that the company can decide to re-invest in the business, use to acquire other companies, or pay out to shareholders in the form of dividends or share repurchases.
Something Buffett likes to see in a stock is good treatment of shareholders. At the time of this writing, Hasbro currently has a dividend yield of just over 4%, which is pretty good. They also have an on-going share repurchase program. Since 2008, Hasbro has repurchased about 10.6 million shares. The result has been a steady increase in earnings per share. After valuing Hasbro's future cash flows with a modest 5% growth per year, I came up with a valuation of the company that is higher than its current share price, offering a margin of safety around 25%. If I were to assume a higher growth rate, that margin of safety would be larger, but I don't want to over-estimate. In any case, I had all but convinced myself that this stock would be a good buy, according to the value investing principles I have been learning about. The only reason I haven't purchased this stock yet is that I'm still waiting on transferring my RRSP account over to a self-directed account that I can use to buy individual stocks. Perhaps this was a blessing in disguise.
Buffett says that when you find a good investment, you should place a sizeable chunk of cash on it. Since I would be placing a sizeable chunk of cash on Hasbro, I want to be sure that I'm right about its prospects. After all, the whole strategy of focus investing is simply to just buy good companies, and avoid bad ones. I wanted to make sure I wasn't buying a bad one. It seemed strange to me that shareholders were being so lavishly rewarded year after year with dividend payouts and share repurchases, when news pieces on Hasbro had such a modest or grim outlook. I whipped up a quick spreadsheet, and here is what I found:
From what I see in the spreadsheet, Hasbro has been paying out more than 100% of its owner earnings to shareholders! At the same time, it has been borrowing hundreds of millions each year. It looks to me like this is unsustainable. Cash should only be paid out to shareholders if it can't be better used elsewhere to grow the company and add value for shareholders. From what I can tell, at least some of the cash being borrowed and/or paid out to shareholders could probably be better used by re-investing in the business. This realization has led me to reconsider my plans to purchase shares in Hasbro for the time being.
Edit: I did some follow-up research on this topic, and wrote a blog post summarizing my findings.
When considering Hasbro's financials, I found a lot that matched a checklist I've built, based on reading how value investors like Warren Buffett pick stocks. Hasbro has low capital expenditure, consistent profit margins, return on assets in the 9-10% range, growth in net income and growth in what Buffett calls "owner earnings". Owner earnings, or free cash flow, are equal to the company's net income, plus depreciation/amortization, minus capital expenditures. Since depreciation/amortization are a non-cash expense, the cost is added back in to the equation, and offsetting depreciation/amortization is taken into account by subtracting capital expenditures. The result is the amount of cash that the company can decide to re-invest in the business, use to acquire other companies, or pay out to shareholders in the form of dividends or share repurchases.
Something Buffett likes to see in a stock is good treatment of shareholders. At the time of this writing, Hasbro currently has a dividend yield of just over 4%, which is pretty good. They also have an on-going share repurchase program. Since 2008, Hasbro has repurchased about 10.6 million shares. The result has been a steady increase in earnings per share. After valuing Hasbro's future cash flows with a modest 5% growth per year, I came up with a valuation of the company that is higher than its current share price, offering a margin of safety around 25%. If I were to assume a higher growth rate, that margin of safety would be larger, but I don't want to over-estimate. In any case, I had all but convinced myself that this stock would be a good buy, according to the value investing principles I have been learning about. The only reason I haven't purchased this stock yet is that I'm still waiting on transferring my RRSP account over to a self-directed account that I can use to buy individual stocks. Perhaps this was a blessing in disguise.
Buffett says that when you find a good investment, you should place a sizeable chunk of cash on it. Since I would be placing a sizeable chunk of cash on Hasbro, I want to be sure that I'm right about its prospects. After all, the whole strategy of focus investing is simply to just buy good companies, and avoid bad ones. I wanted to make sure I wasn't buying a bad one. It seemed strange to me that shareholders were being so lavishly rewarded year after year with dividend payouts and share repurchases, when news pieces on Hasbro had such a modest or grim outlook. I whipped up a quick spreadsheet, and here is what I found:
 |
| Data taken from Google Finance |
Edit: I did some follow-up research on this topic, and wrote a blog post summarizing my findings.
Thursday, June 2, 2011
Diversification
In the past few months, I've been reading and learning about how to do fundamental analysis of a stock to determine its growth or value potential. I did some analysis of a few stocks listed on the TSX, and I came up with 15 potential growth candidates. I haven't done any deeper analysis yet, just some initial weeding out of stocks that didn't fit my basic criteria.
I decided to create a new portfolio in Google Finance and add my 15 hopefuls to it, just to see which ones outperformed the others. I added hypothetical transaction data to each stock so that the cost basis was around $500 for each one. This is my personal minimum amount to invest in a stock, since it makes brokerage fees around 1% of the total amount being invested. All in all, my hypothetical cost basis was around $7,700. In the two weeks since I started the portfolio, it has gone up to +3% and is now around +1.6%. While it's true that two weeks is a very short time frame for growth investing, I realized something as I checked on the portfolio every day.
I have read many times before how diversification in a portfolio is essential for mitigating concentration risk. I didn't actually realize the true value of diversification until I saw it in action. The worst of my 15 picks is currently down $62. However, my overall portfolio is up by $63. Just under half of my picks are in the red by small amounts, but from diversifying across multiple stocks I have managed to keep the overall portfolio value positive.
Since this is all hypothetical, it's purely for the sake of learning on my part. However, it made me re-examine my current strategy for my real stock portfolio. Up until now, I've been working on building a dividend growth portfolio. The dividend growth strategy is a valid strategy, however it takes a fair amount of capital before the dividends start to really pay off. The dividend growth strategy also takes patience, which I don't seem to have when I say that I'm considering switching strategies.
I have two excuses for moving away from the dividend growth strategy for the time being. Firstly, my whole investing experience so far has been all about learning as much as I can, both by reading about the vast amount of things there are to know about investing, and also to learn by doing. Learning investing through hands-on experience was my inspiration for starting this blog in the first place. Secondly, as I mentioned above, it takes a significant amount of capital to earn meaningful dividend amounts through a brokerage account every so often. It's a little different if you buy shares direct and can hold fractional shares, but that's not the case for me.
So after taking a good look at my diversified pretend portfolio, I saw the true power of diversification and the role it plays in growing your money. Since I have a very limited amount of money to invest with, I decided to try and grow my account more efficiently and effectively. Perhaps a few years down the road when I have more income available and a larger balance in my TFSA, I can consider re-implementing the dividend growth strategy.
If I want instant diversification and my TFSA is a discount brokerage account, what's the first thing that comes to mind? ETFs! I did a little research on what types of ETFs are available on the TSX, and what sectors and market caps they cover. I came up with a few choices and put them into a new hypothetical portfolio in Google Finance. Then I scrolled down to the portfolio performance window, and checked off the box for comparing portfolio performance with that of the S&P/TSX index. As it turns out, my ETF choices outperform the S&P/TSX by almost 10% over the past 12 months! I have yet to examine the risks associated with each ETF, and I also need to decide what percentage of my portfolio each ETF should occupy. I'm excited to try out a new strategy, and I've now given you fair warning for the types of posts you might see on this blog in the near future.
Monday, December 6, 2010
My Attempt At Technical Analysis
I've been waiting for over a month or so to see how this stock turned out, before I wrote a blog post about it. A while ago, I decided to try my hand at trading on some basic technical analysis. I had read about support and resistance and printed off a few stock charts. After drawing support and resistance lines on the charts, I decided to try and trade IMG.TO (IAMGOLD Corporation) to see if I could make some capital gains based on my chart. The following is a screenshot of IMG.TO over the past six months from the time of this writing, as well as my support and resistance lines drawn in. I've also marked where I bought (blue arrow) and sold (red arrow) the stock.

My figuring at the time point where the blue arrow is, was that this stock price had been bouncing off its resistance for a while now (the middle green line), and was coming up again for another try. I read that if a price breaks its resistance, that level will often become the new support level for the price, and the price will shoot upwards. I figured that if I were lucky and hopped on board right when it broke resistance, it might shoot up. If I were even luckier, it might shoot up past its longer-term resistance (top green line) and who knows how much higher. Obviously I had some unhealthy expectations for this stock.
So I bought the stock at the blue arrow on the chart. I bought twice as much as I meant to, because first I placed a limit order. Since I wasn't patient enough for the price to hit my limit order, I canceled the order and placed a market order. Then the price reached my limit order (which I thought I had canceled), and I mistakenly bought twice the number of shares that I had meant to. I suppose that counts as another one of my mistakes to post about on this blog. In any case, I held on to see what would happen.
Unrelated to stock trading, it turned out that I needed the money I was trading with. For reasons why, see my post about investing while unemployed. The price dipped a little, and when it went back to where I had bought it, I figured I would stop while I was at break-even (including commission fees), and sell the shares, since I needed the money. I've made some mistakes in investing so far, but I know not to trade with money I can't afford to lose. So I sold the shares at the red arrow.
I still paid attention to the stock, to see if it turned out that I was right with my basic technical analysis predication based on support and resistance. As of December 6th, the stock has gone down quite a bit (as you can see from the chart) compared to where I bought shares. Through pure luck of pulling out when I did, I missed out on the big plunge. Had I held on, I probably would have fallen for the same mistake I had suffered once already.
I've decided not to trade on the basis of technical analysis from now on for two reasons: it's not an exact science, and it does not fit with my dividend growth investing strategy. I've heard statistics saying that a significant percentage of day traders lose money overall, and their trading is largely based on technical analysis. I haven't labeled this post as a mistake or a success, as it was neither. It was simply another step in my journey of learning about investing in the stock market, and I've shared the results in this blog post.
Friday, October 22, 2010
Stock Analysis: National Bank of Canada (NA.TO)
My first purchase toward my dividend growth strategy involved several considerations, but I ended up deciding on buying shares in National Bank of Canada. The following are the reasons why I decided to buy shares. Information is accurate as of October 21, 2010.
National Bank of Canada has a market capitalization of $10,979,300,000. It is part of the financial sector, meaning its main services offered are personal and business banking, and investment options. It was founded in Quebec City in 1859, and has maintained or increased its dividend per share for 18 years in a row.
Here are some quick facts:
Annual Dividend: $2.48 per share
Dividend Yield: 3.66%
Dividend Payout Ratio: 43.68
Price/Sales Ratio: 2.54
Price/Earnings Ratio: 11.93
Graham Number: $73.89
Beta: 0.53
The dividend yield is a good amount, and its higher than that of the S&P Composite Index at 2.58%. The dividend payout ratio is below 50, meaning that the company's earnings should be able to support dividend growth. The price/sales ratio and the price/earnings ratio are both lower than other companies in the same sector, making this stock a more valuable buy than others. The Graham Number (maximum price you should be willing to pay for a stock) is much higher than the current stock price of $66.90, which is a good indicator. A beta value of 0.53 means that the stock is about half as volatile as the overall market.
Another thing to look at is the company's earnings per share (EPS) over the past few years. A good dividend growth stock should have a continually increasing EPS to be able to grow their dividends.
The EPS is a little all over the place, due mainly to the recession. I wasn't able to find EPS data before 2007. The earnings seem to be at least stable when there isn't as much economic uncertainty. However, the fact that National Bank of Canada couldn't keep earnings stable during the recession is a point against it.
So once I decided that this would make a good start for my dividend growth portfolio, I sold my shares in a dividend exchange-traded fund, and purchased a position in National Bank of Canada (NA.TO).
Disclaimer: I am not a professional investor, nor am I recommending that anyone buy this stock. Due diligence is always required when making a purchase decision.
National Bank of Canada has a market capitalization of $10,979,300,000. It is part of the financial sector, meaning its main services offered are personal and business banking, and investment options. It was founded in Quebec City in 1859, and has maintained or increased its dividend per share for 18 years in a row.
Here are some quick facts:
Annual Dividend: $2.48 per share
Dividend Yield: 3.66%
Dividend Payout Ratio: 43.68
Price/Sales Ratio: 2.54
Price/Earnings Ratio: 11.93
Graham Number: $73.89
Beta: 0.53
The dividend yield is a good amount, and its higher than that of the S&P Composite Index at 2.58%. The dividend payout ratio is below 50, meaning that the company's earnings should be able to support dividend growth. The price/sales ratio and the price/earnings ratio are both lower than other companies in the same sector, making this stock a more valuable buy than others. The Graham Number (maximum price you should be willing to pay for a stock) is much higher than the current stock price of $66.90, which is a good indicator. A beta value of 0.53 means that the stock is about half as volatile as the overall market.
Another thing to look at is the company's earnings per share (EPS) over the past few years. A good dividend growth stock should have a continually increasing EPS to be able to grow their dividends.
 |
| This graph shows EPS from 2007 to 2010. |
So once I decided that this would make a good start for my dividend growth portfolio, I sold my shares in a dividend exchange-traded fund, and purchased a position in National Bank of Canada (NA.TO).
Disclaimer: I am not a professional investor, nor am I recommending that anyone buy this stock. Due diligence is always required when making a purchase decision.
Subscribe to:
Posts (Atom)